Smart Learning Feedback Maps, By Pen Lister. December 9, 2016. Categories: Tutorials and Guides Tags: feedback, maps
NB this post was originally published in Dec 2016, then the map scripts and design was modified to the design shown in the screenshot, then the scripts finally stopped working altogether as Sheetsee js dependency Tabletop js was discontinued.
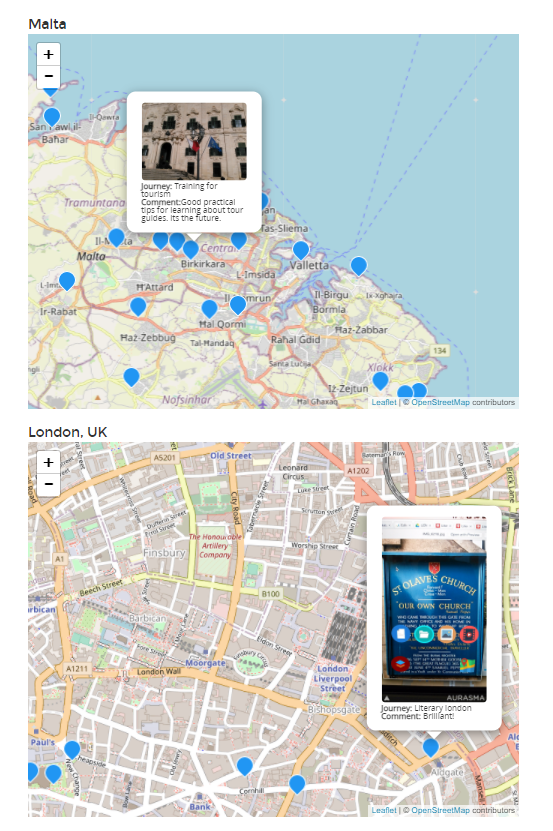
These are map visualisations of feedback from learners taking part in smart learning journeys. They show where learners posted their feedback reports, and include images uploaded and comments from the learner, as well as the name of the journey. Currently updating almost automatically, with small human assistance.
Smart Learning Feedback Maps
_ = = = = = Archived scripts no longer active 2022 = = = = = = _
Malta
London, UK
- Click on each location to see feedback comments and shared images
- To submit your feedback you’ll need a password to get access to a form. You need to be on a learning journey to get that!
Technical information: These maps use Sheetsee.js scripts for visualising data from Google Spreadsheets. Maps are updated live, as new row entries appear in the spreadsheets. Making use of coordinates submitted from learner feedback forms (using Jotform) and json data column callbacks, we can visualise individual learner feedback submissions for a particular journey and locality. Nice! See more scripts from jlord on github.